

The Problem
Across the United States, vacancies in the educator workforce have drastically increased, exacerbated by the COVID-19 pandemic.1 Leading up to the 2021–22 school year, Colorado schools sought to fill 5,729 teaching positions, representing 10.33% of all teaching positions in the state. Of those positions, 1,568 (27.37%) remained unfilled for the school year.2 Estimates of the cost to replace a teacher range between $9,000 to more than $20,000 per teacher depending on the geographic setting of the district (such as rural, suburban, or urban).3 A high-leverage need to attract, prepare, and retain teachers in the education profession created an opportunity for state education leaders to collaborate with federal technical assistance providers, determine possible solutions, and take steps toward strengthening and diversifying Colorado’s educator workforce.
Region 12 Comprehensive Center: Capacity Building for a Solution
The R12CC project Using Place-Based Decision Making to Strengthen the Colorado Educator Workforce Pipeline was established, in partnership with the Colorado Department of Education (CDE) and Regional Educational Laboratory Central (REL Central), to address this high leverage need. The Strengthening the Colorado Educator Workforce Pipeline geographic information system (GIS) map supports education leaders to better understand, and address, the factors influencing educator shortage challenges. GIS software uses interactive maps to display multiple layers of data, connecting a range of data systems (such as district educator shortages, educator preparation program enrollment and completers, district retention and attrition, and other district and county economic data) to provide a robust snapshot of local, regional, and state educator workforce issues. With educator workforce trends, the GIS maps allow for a deeper examination of “place effects,” which are the specific factors contributing to teacher recruitment and retention in a particular geographic area. As a result, the GIS map provides a resource for local and regional leaders to tailor recruitment and retention strategies to their unique contexts (for example, urban/rural, rural mountain/rural plains).
To build awareness, use of, and engagement with the GIS map, R12CC launched sessions for interested parties, using virtual meetings due to the COVID-19 pandemic. These sessions served two purposes: 1) to introduce and acclimate users to the GIS map tool, how to use it, and the types of research questions supported by the tool; and 2) to support usage of the map so that education leaders could examine their regions, see factors promoting or prohibiting a strong educator workforce, and develop plans to address workforce development and diversification. A virtual Community of Practice (CoP) was launched in 2022, bringing together a range of potential users (including school, district, and state education leaders as well as representatives from educator preparation programs) to examine data from the GIS map, conduct root cause analyses, identify strategies to address root causes, and develop action plans to implement strategies. Four customized data analysis sessions were offered to individual groups such as district teams and individual schools to identify key findings, develop data interpretations, and support them in developing recommendations for policy or practice.
Lessons Learned
The team is currently reflecting on two takeaways from the project as it has evolved. First, R12CC is reevaluating its engagement efforts. When the project initially launched, the team saw a need to provide a robust framework to introduce the GIS map as a new resource, build technical skills for clients and education leaders to use the resource, and create space for dialogue and excitement. While the resources and activities were well received, participation was inconsistent, with attrition of participants over time and dwindling engagement toward the end of the academic year. Clients noted, “The materials and information (for using the GIS map) have been made available, but we struggle to engage educators.” When asked if educators have increased their ability to analyze data to inform plans to strengthen the workforce pipeline, clients replied, “Those who have attended our outreach activities have increased their abilities.” They expressed hope for further engagement with the GIS map: “The people in talent development and workforce see the value… [people from] other tangential areas…aren’t connecting to the maps and we need to find a way to illustrate to them how useful they can be.” Overall, engagement remains the primary challenge, and R12CC and CDE continue to find innovative solutions.
Second, R12CC is grateful for the lessons learned related to building and maintaining a strong partnership with other technical assistance providers. This project benefitted from the partnership between two of the U.S. Department of Education’s technical assistance and support providers—R12CC and the Regional Educational Laboratory (REL) Central. Collaboration between R12CC and REL Central helped ensure that their respective capacity-building efforts to support the educator workforce pipeline were complementary, nonduplicative, and leveraged the strengths of both programs. As a result, this partnership exemplifies collective impact, by working together to solve complex problems, leverage human and resource capacity, and attain results greater than the individual organizations could achieve.
Project Outcomes
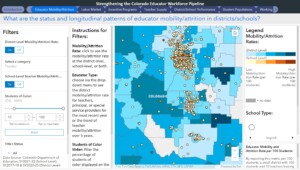
Figure 1. Strengthening the Colorado Educator Workforce Pipeline GIS Map
To date, this project has met several outcomes. The first, and primary, outcome was the creation of a new tool to support education leaders in strengthening the educator workforce: the GIS map. The map was successfully launched in 2021 and is live and available for use by local education agencies (LEA), state education agency (SEA) staff, and other interested parties.
One client from the CDE shared that “The GIS maps have pulled together data in ways that we haven’t seen before.” Another client commented, “We could not have done this (GIS map) without their (R12CC) support. We do not have the bandwidth nor the expertise without them. I believe we are going to find a way to catch people’s attention and get a lot more mileage out of this (tool).” In 2024, additional work will focus on professional learning and coaching with CDE staff to help ensure long-term sustainability of the map.
The second outcome was the introduction of the GIS map to a wider range of interested groups to build their technical skills and encourage data use to address educator shortages. Engagement opportunities resulted in seven CoP meetings with intermittent participation from 35 educators, as well as customized data analysis sessions with four entities. CoP participants expressed appreciation for the new resources and shared positive reflections around networking and collaboration opportunities. CDE also expressed appreciation for the way the webinar and data analysis sessions are facilitated, with input gathered from registrants in advance so that content could be appropriately tailored for the audience.
 Communication has been key to ensure that the GIS tool is useful and relevant for users. For example, in response to an increased awareness of the importance of teacher diversity and emphasized in feedback obtained during engagement sessions, a “teacher diversity” tab was added to the map to display districts with the largest percentage of Black, Indigenous, and people of color students and teachers. Dr. Carolyn Haug, director of Research and Impact, Educator Talent Division at CDE commented, “This allows our [users] to look at districts across the state and ask: Where are our students of color? Where are our teachers of color? And how do those two things relate to each other district by district? We can now pinpoint areas of the state where we have high levels of students of color and low levels of educators of color.”
By emphasizing communication and introducing the GIS map to a wider range of interested groups, the map will persist as a resource to address educator shortages. Further, GIS map updates and sustainability planning will help CDE maintain the map beyond the current Comprehensive Centers program cycle and continue to strengthen and diversify the educator pipeline in Colorado.
References
1 National Center for Education Statistics. (2022). U.S. schools report increased teacher vacancies due to COVID-19 pandemic, new NCES data show. https://nces.ed.gov/whatsnew/press_releases/3_3_2022.asp
2 Colorado Department of Education. (2023). Colorado’s educator shortage survey results. https://www.cde.state.co.us/educatortalent/edshortage-surveyresults
3 Learning Policy Institute. (2018). U.S. teacher shortages – Causes and impacts. https://learningpolicyinstitute.org/sites/default/files/body/Teacher_Shortages_Causes_Impacts_2018_MEMO.pdf
Note
This Impact Story was originally published on May 16, 2023, and has been updated to reflect progress made to date.